Google Ads Case Study: Real Estate Lead Generation

Google Ads Case Study
29% Increase in Qualified Seller Leads
for Real Estate Seller Lead Generation (Germany)


✔ +29% Qualified Seller Leads
✔ –12% Cost per Lead (CPL)
✔ Up to 32 Seller Leads / Month
About The Client
The client is a regional residential real estate brokerage in Germany specializing in property sales and home valuation services. Their primary goal was generating qualified homeowner inquiries from people interested in selling their property.
The Challenge
The account faced several challenges common in competitive real estate markets.
1. Seasonal demand fluctuations
Property-related search demand varies throughout the year. During the summer months, search activity and lead volume typically decline, while demand increases again toward the end of the year.
2. High competition for seller leads
Search queries related to property sales and valuations are highly competitive, with many agencies and portals bidding on the same keywords.
3. Maintaining cost efficiency while increasing lead volume
Increasing campaign budgets during peak demand periods often leads to higher cost per lead if not managed carefully.
4. Traffic quality and intent alignment
Generating leads from highly relevant search queries was essential to avoid wasted spend on low-intent traffic.
Google Ads Strategy & Campaign Structure
The strategy focused on capturing high-intent homeowner searches while maintaining cost efficiency through careful campaign structure and continuous optimization.
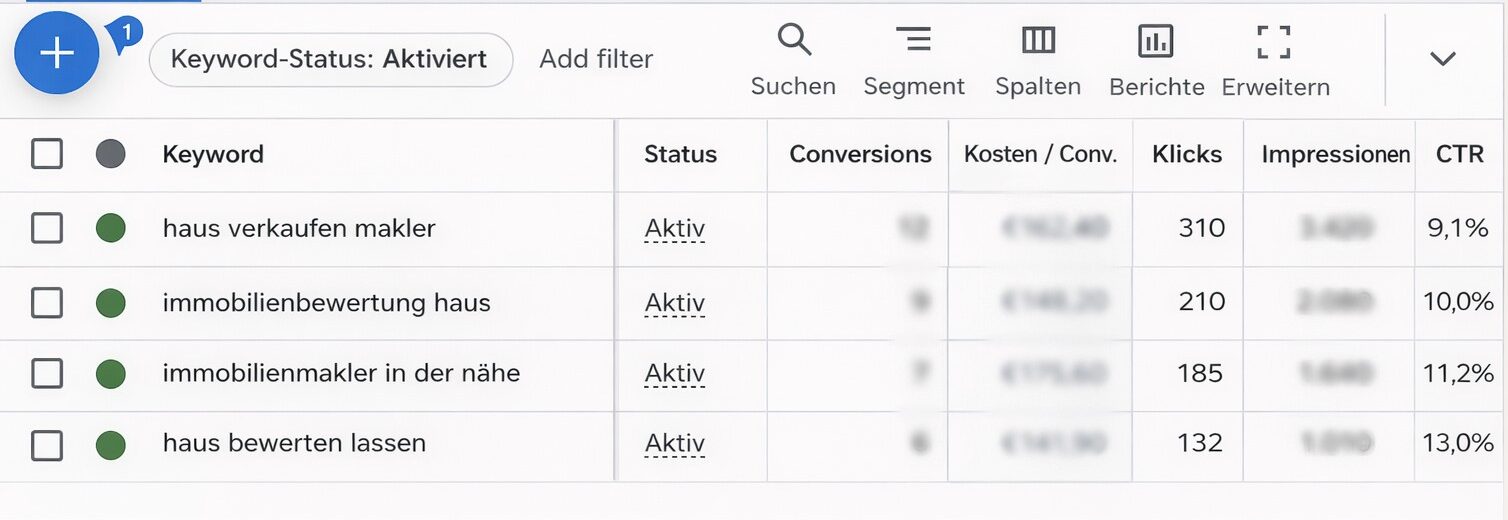
Keyword & Search Intent Strategy
The campaigns were structured around high-intent property seller queries, targeting users actively searching for property valuation or selling services.
Examples of keyword intent types included:
Transactional:
Sell house with agent
Property valuation service
Commercial:
Best real estate agent near me
Real estate broker for selling property
Local intent:
Real estate agent [city]
Property valuation [city]
Continuous search term analysis helped identify new keyword opportunities while eliminating irrelevant traffic through negative keywords.
Campaign Structure
The account used a combination of Search campaigns and Performance Max campaigns.
Search Campaigns
Focused on high-intent property seller queries.
Structured by keyword themes and geographic targeting.
Optimized for lead conversions.
Performance Max Campaigns
Supported demand capture across multiple Google channels.
Assisted in remarketing and broader visibility.
Expanded reach beyond search-only traffic.
Budget & Bid Strategy Optimization
Campaign performance was monitored continuously, and bidding strategies were adjusted based on conversion data.
Key optimizations included:
Reallocating budget toward consistently converting campaigns.
Increasing spend during peak demand periods.
Monitoring cost per lead during scaling phases.
Adjusting bid strategies based on seasonal demand patterns.
This ensured that campaign growth remained efficient while increasing lead volume.
Performance Overview
Click & Cost Trends
During the first phase of the campaign, budgets were managed carefully to establish a reliable performance baseline while gradually increasing visibility for high-intent search queries.
As shown in the campaign performance charts, a noticeable seasonal dip occurred during the summer months when property-related search activity typically declines.
During the spring months, campaign performance improved as homeowner search activity increased. Following a typical summer slowdown in July and August, performance began recovering again in early autumn.
Conversions & Cost Per Lead
Lead volume increased significantly during peak demand months, particularly during September and October.
Even with increased budgets and traffic, the cost per lead remained within a controlled range. This indicates that performance improvements were driven by better traffic quality and campaign optimization rather than simply increased spend.
Conversion rate also improved compared to the early campaign period, demonstrating stronger alignment between search queries and user intent.
Performance Quality Indicators
Beyond volume metrics, several indicators confirmed sustained campaign improvements:
• Higher conversion rate compared to the early campaign phase
• Stable cost per lead despite increased campaign budgets
• Reduced wasted spend through search term and negative keyword optimization
• Improved performance predictability across months
• Efficient scaling with proportional growth in lead volume
These indicators demonstrate that the campaign improvements were driven primarily by optimization and traffic quality improvements rather than budget increases alone.
Results & Performance Metrics
Over the 12-month campaign period, the Google Ads strategy produced measurable improvements in both lead volume and campaign efficiency. Lead volume ranged between 12 and 32 qualified seller inquiries per month, while cost per lead remained within a controlled range.
Continuous optimization of keywords, bidding strategies, and search term filtering helped improve campaign efficiency and maintain stable lead generation throughout the year.
Key performance improvements included:
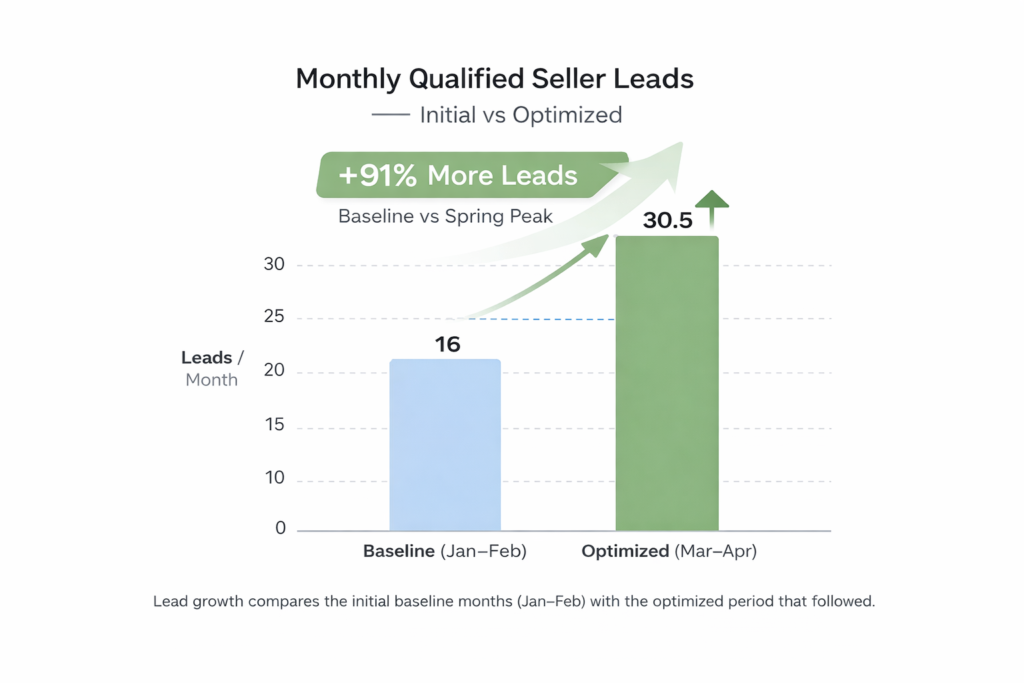
✅ +29% average increase in monthly qualified seller leads
✅ Stable cost per lead despite increased campaign budgets
✅ Strong lead generation during the spring demand peak (Mar–Apr)
✅ Stable performance during seasonal demand fluctuations
✅ Improved predictability and stability of monthly lead generation
Lead growth compares the initial campaign baseline period (Jan–Feb) with the optimized campaign performance across the remaining months.
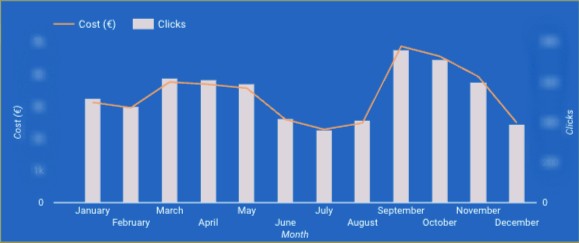
Campaign Spend & Traffic Trends
During the first half of the campaign period, budgets were kept relatively stable to establish a reliable performance baseline.
A noticeable seasonal dip occurred during July and August, when property-related search demand typically declines due to the summer holiday period.
Despite increasing budgets during high-demand periods, traffic quality remained strong and overall campaign efficiency was maintained.
📊 Google Ads Campaign Performance (12-Month Period)
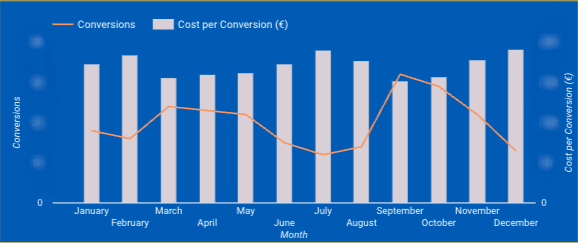
Conversions & Cost Per Lead
Lead generation increased significantly during the spring selling season, particularly between March and April, when homeowner search demand for property valuations and real estate agents was highest.
A secondary increase in demand occurred during the early autumn months, when search activity began recovering after the summer slowdown.
Even with higher traffic volumes and increased campaign budgets, the cost per lead remained within a stable range, indicating that performance improvements were driven by better targeting and campaign optimization rather than simply higher spend.
The improved conversion rate also demonstrates stronger alignment between search queries and user intent.
Some campaign details have been generalized to protect client confidentiality.
Key Takeaways & Market Insights
Campaign Timeline Insights
The campaign performance followed a clear seasonal pattern typical for residential real estate markets.
Baseline Phase (Jan–Feb)
The campaigns were launched and optimized during the initial learning phase while establishing a reliable performance baseline.
Optimization Phase (Mar–Jun)
As campaign data accumulated and keyword targeting was refined, lead generation increased significantly during the spring selling season.
Seasonal Demand Dip (Jul–Aug)
Search demand for property sales declined during the summer holiday period, leading to lower lead volume across the market.
Market Recovery (Sep–Oct)
Lead volume began recovering in early autumn as homeowner search activity increased again after the summer slowdown.
Understanding these seasonal demand cycles allowed the campaigns to scale efficiently during high-demand periods while maintaining cost control during slower months.
Full-Funnel Google Ads Management
READY TO GROW?
Let’s get to work.
What Our Clients Say About Working With Us
“We received active support with our online marketing and achieved excellent results. The team kept us well informed and continuously highlighted opportunities for optimization. The cooperation was friendly, transparent, and highly professional — we are happy to recommend this service.”

“Outstanding work in online marketing, whether it’s SEO or SEA. A true specialist team that is always reliable and takes care of any issues promptly. Highly recommended.”